
Table of Contents
What is included in this blog post ?
In this blog post we discuss about the importance of pg_buffercache and pgfincore extensions . Postgres uses shared_buffers and OS cache to cache data,indexes,.. (In Aurora it only uses shared_buffers). We discuss the internals of caching and various methods to measure cache usage in this article. Caching is an important part of performance tuning and we recommend you to go through all sections of this article
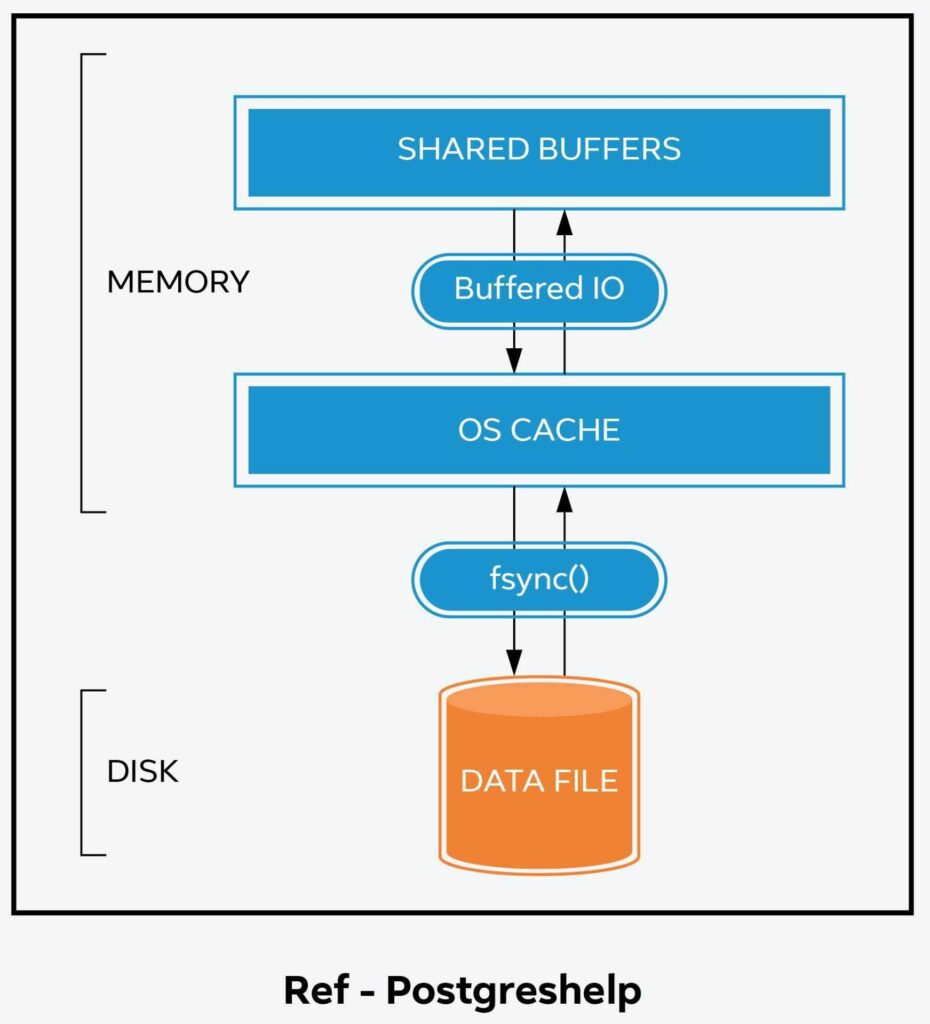
OS caching in Postgres
In addition to shared_buffers , Postgres also uses OS cache to buffer data,indexes,.. Below diagram illustrates the usage of shared_buffers and OS cache in Postgres
Using pg_buffercache
Pg_buffercache can be used to study the contents of shared_buffers . Using this extension you can tell if a particular relation is cached or not(in shared_buffers) . This extension can help you in troubleshooting performance issues (caching related performance issues)
How to install pg_buffercache extension ?
This is part of contrib and it is very easy to install this extension . You can just run below command to activate this extension
Create extension pg_buffercache ;
Using pg_buffercache - How to get stats for a particular table ?
SELECT sch.nspname as schema_name, c.relname as table_name,c.relfilenode,c.relpages FROM pg_class c JOIN pg_namespace sch ON sch.oid = c.relnamespace WHERE c.relname='tablename' and sch.nspname='schemaname';Once you obtain relfilenode , you can execute below query to get caching stats (substitute your relfilenode )
Select b.bufferid,b.relblocknumber,b.isdirty,b.usagecount

From pg_buffercache as b

Where b.relfilenode=1931058964 ;
NOTE : You can also perform join and use one single query instead of using two different queries
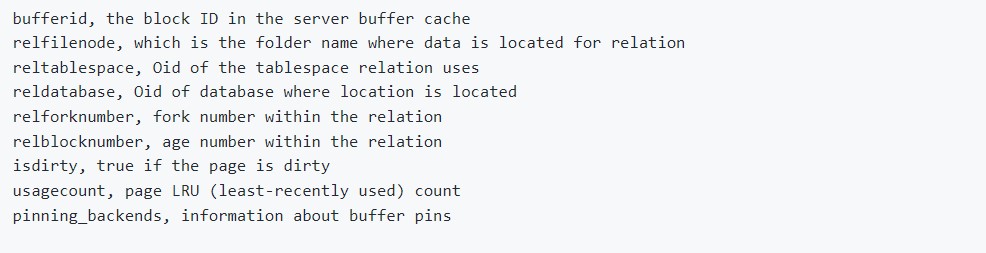
Using pg_buffercache - What are the columns in output ?
Below are the columns in pg_buffercache output – bufferid ,relfilenode , reltablespace , reldatabase and so on ..
Using pg_buffercache - How to list the number of buffers used by each relation of the current database ?
Below is another useful query that can be used to get buffer stats for top 10 cached relations in your current database
SELECT c.relname, count(*) AS buffers

FROM pg_buffercache b INNER JOIN pg_class c

ON b.relfilenode = pg_relation_filenode(c.oid) AND

b.reldatabase IN (0, (SELECT oid FROM pg_database

WHERE datname = current_database()))

GROUP BY c.relname

ORDER BY 2 DESC

LIMIT 10;
Using pg_buffercache - Caching numbers by database
SELECT CASE WHEN c.reldatabase IS NULL THEN ''

WHEN c.reldatabase = 0 THEN ''

ELSE d.datname

END AS database,

count(*) AS cached_blocks

FROM pg_buffercache AS c

LEFT JOIN pg_database AS d

ON c.reldatabase = d.oid

GROUP BY d.datname, c.reldatabase

ORDER BY d.datname, c.reldatabase;
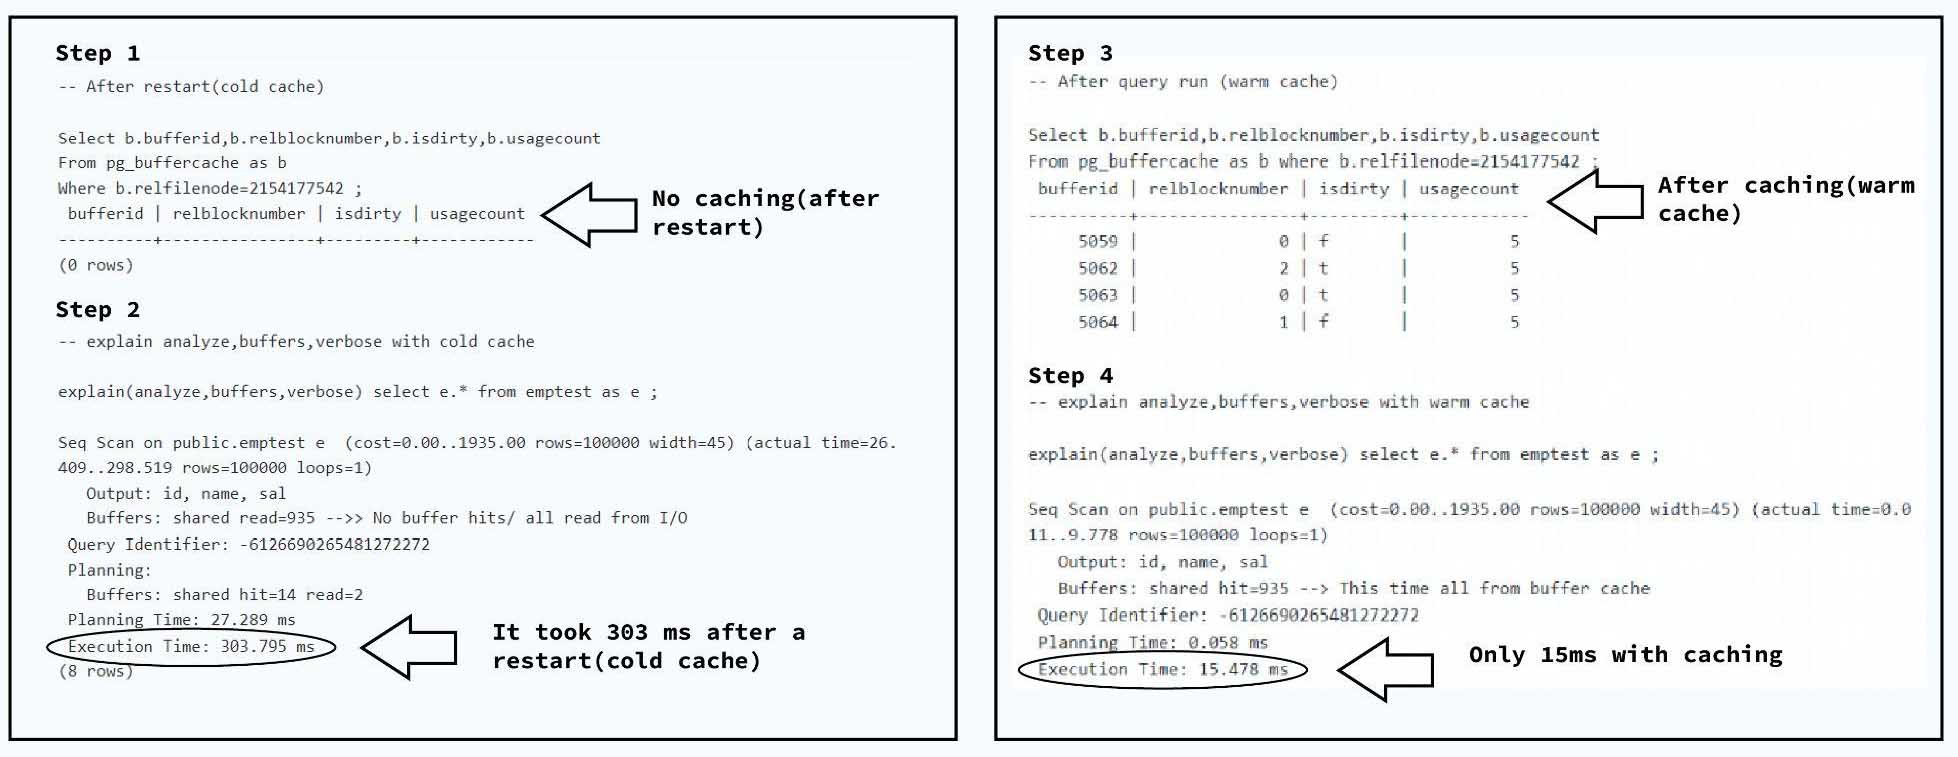
Pg_buffercache and performance tuning - An example scenario
In below example we first checked if ‘emptest’ table is cached using pg_buffercache (after a restart). As you can see there are zero records in pg_buffercache output . We later ran ‘explain analyze’ and the query took about 304 ms (without caching) . We then checked cache contents using pg_buffercache and observed that relation is cached this time . We later executed the same query and this time it completed in 15 ms ( a 20X improvement with caching )
Using pgfincore
We have seen how pg_buffercache can be used to study contents of shared_buffers . Can we use the same extension to study OS cache ? The answer is No. Pg_buffercache is only useful to study the contents of shared_buffers and not OS cache
You can use pgfincore to study OS cache . It internally uses fincore(),mincore() and POSIX_FADVISE. There is not much content available on the internet about its usage . We have used this extension to address a performance bottleneck and are going to present some interesting snippets here
How to install pgfincore ?
You can follow instructions given in the github repo https://github.com/klando/pgfincore
There are two methods – 1) Source method 2) Package/RPM install
For source method you can use below commands
make clean

make

su

make install
For debian package method you can use something like below
aptitude install debhelper-compat postgresql-all

make deb
You can install the debian package generated after above two steps
NOTE – You might run into some issues with install (depending on your OS version etc..)
Pgfincore installation and configuration issues
While installing you might run into issues . For example , we ran into below error when we were using the debian package method . We fixed it by using correct version in “aptitude install debhelper-compat postgresql-all”
dpkg-buildpackage: info: host architecture amd64
dpkg-source –before-build .
dpkg-checkbuilddeps: error: Unmet build dependencies: debhelper-compat (= 13) postgresql-all (>= 217~)
dpkg-buildpackage: warning: build dependencies/conflicts unsatisfied; aborting
dpkg-buildpackage: warning: (Use -d flag to override.)
make: *** [Makefile:25: deb] Error 3
Another error we saw is noted below . Make sure you follow the steps to finish your install before running “create extension”
postgres=# CREATE EXTENSION pgfincore;
ERROR: could not open extension control file “/usr/share/postgresql/14/extension/pgfincore.control”: No such file or directory
postgres=#
Also you need to run pgfincore–1.2.sql if the functions are not available after creating extension
NOTE : Please reach us at support@klouddb.io if you run into any other issues , We will try to help you
Performance tuning with pgfincore - Realtime example
In this blog we are going to present a realtime scenario where we improved our query performance using pgfincore
We are using the sample schema postgres_air ( Check https://klouddb.io/db-utility-to-deploy-4-postgres-sample-dbs-pagilapostgres_airdvdrentalpgbench/ )
Quey used for this scenario is “ select * from passenger p , boarding_pass b where b.passenger_id=p.passenger_id and seat=’8E’ ; “ . It is a simple query which joins passenger and boarding_pass tables
Pgfincore tuning scenario - After VM restart
We restarted VM to clear contents of OS cache and shared_buffers. We verified both shared_buffers and OS cache contents
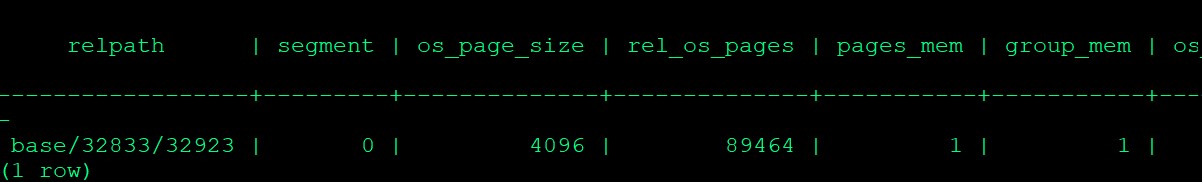
We executed “select * from pgfincore(‘postgres_air.boarding_pass’); to check contents of OS cache for boarding_pass table. As you can see nothing is cached (Check pages_mem column)
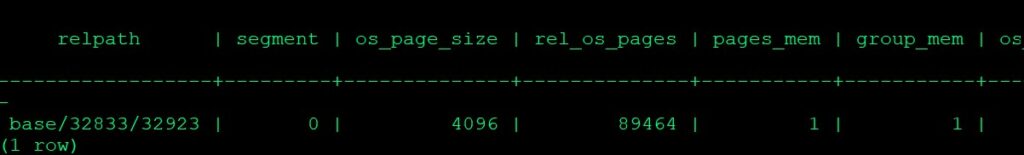
Note – We also checked pg_buffercache contents to validate the contents for this table (to make sure that it is not cached there as well)
Query took around 46 seconds (After VM restart and without any caching )
Pgfincore tuning scenario - Taking backup using Pgfincore
Pgfincore can be used to cache a table on demand using snapshot/restore technique . NOTE : This needs to be tested well before using in your environment . Make sure you run all the load tests needed before you can start using this method(to boost your performance)
After a vm restart it took about 46 seconds to complete as seen above. We ran the query multiple times to ensure that it is cached in OS cache . We also validated using pgfincore before taking snapshot
To take a snapshot you can use a command like below
create table pgfincore_snapshot as select ‘postgres_air.boarding_pass’::text as relname,*,now() as date_snapshot from pgfincore(‘postgres_air.boarding_pass’,true);
Once you run above command it stores the info (databit info etc..) in a table called pgfincore_snapshot
Pgfincore tuning scenario - Restore from pgfincore snapshot
You can use commands like below to restore from previous pgfincore snapshot . NOTE – You need to restore each segment separately . In below example you can see that we restored segment 0 and segment 1 separately (You can also automate this via a script if you have too many segments)
Restore boarding_pass –
select * from pgfadvise_loader(‘postgres_air.boarding_pass’, 0, true, true,(select databit from pgfincore_snapshot where relname=’postgres_air.boarding_pass’ and segment = 0));
select * from pgfadvise_loader(‘postgres_air.boarding_pass’, 1, true, true,(select databit from pgfincore_snapshot where relname=’postgres_air.boarding_pass’ and segment = 1));
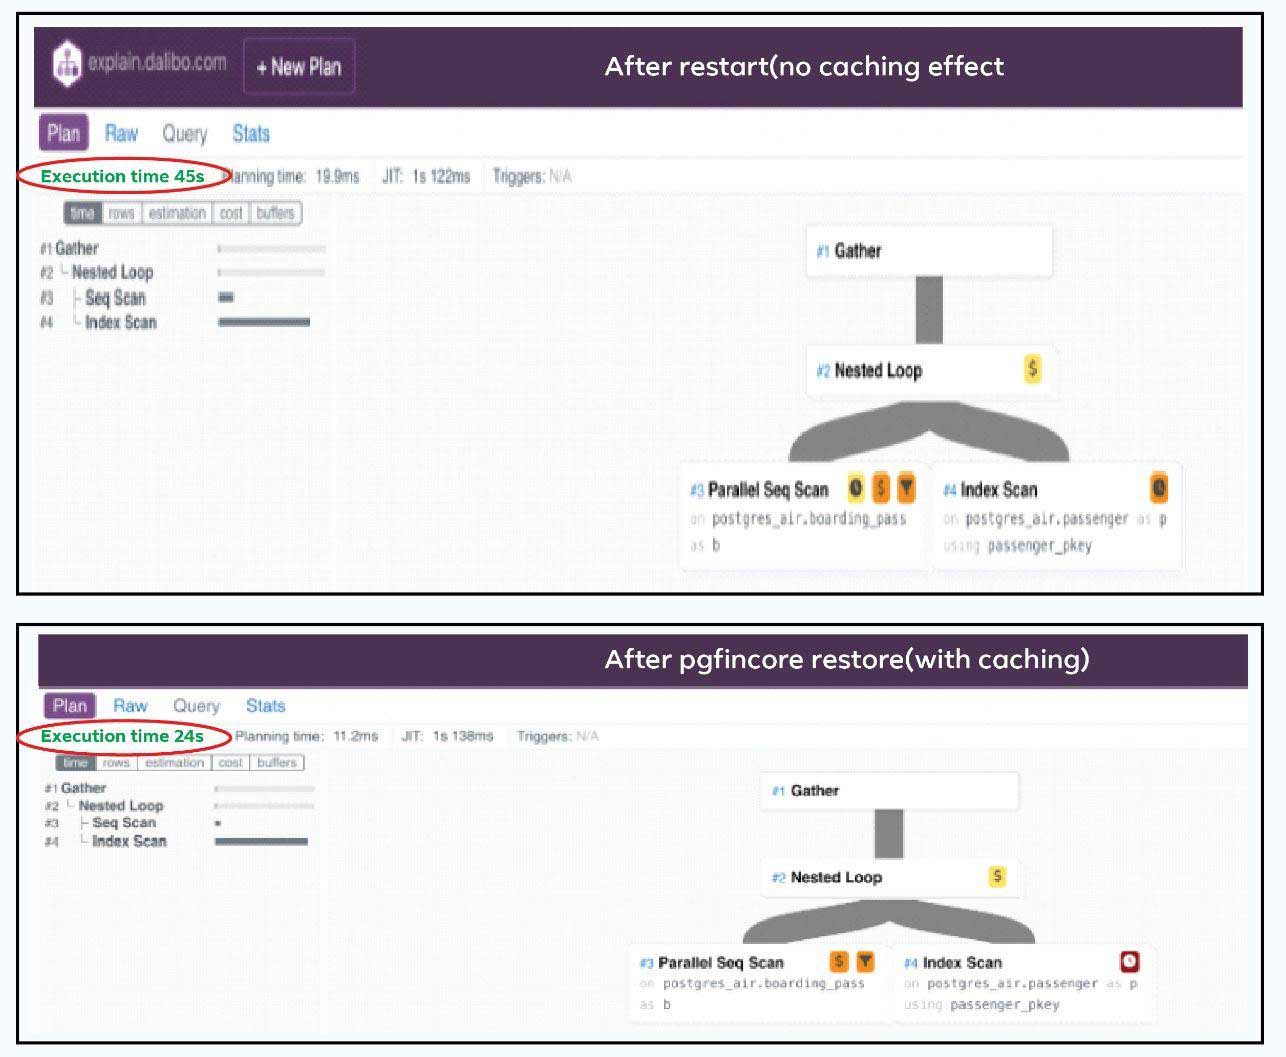
Pgfincore tuning scenario - How we improved response time from 46,000 ms to 24,000 ms using pgfincore ?
To begin with we restarted VM to clear all caches . As you can see nothing is present in OS cache for boarding_pass table (check pages_mem column)
After validating above we restored pgfincore snapshot before testing our query
Restore boarding_pass:
select * from pgfadvise_loader(‘postgres_air.boarding_pass’, 0, true, true,(select databit from pgfincore_snapshot where relname=’postgres_air.boarding_pass’ and segment = 0));
select * from pgfadvise_loader(‘postgres_air.boarding_pass’, 1, true, true,(select databit from pgfincore_snapshot where relname=’postgres_air.boarding_pass’ and segment = 1));
After restore you can see the difference in pages_mem value
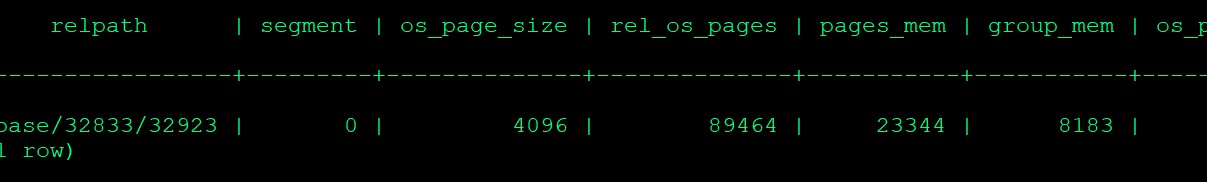
Once we performed restore we saw significant improvement – from 46,000 ms to 24,000 .
NOTE : This is just an example scenario and we could further improve by restoring passenger table contents as well , Always benchmark and test for your case (Use it with extreme caution in production environments)
How to get BUFFERS stats in explain plan ?
In order to measure IO timing and get buffers info for a query ,you can run your explain analyze (Example below)
set track_io_timing=ON ; explain(analyze,verbose,buffers,timing ON) select * from passenger p , boarding_pass b where b.passenger_id=p.passenger_id and seat=’8E’ ;
Please note that we are using additional options like buffers ,track_io_timing etc..
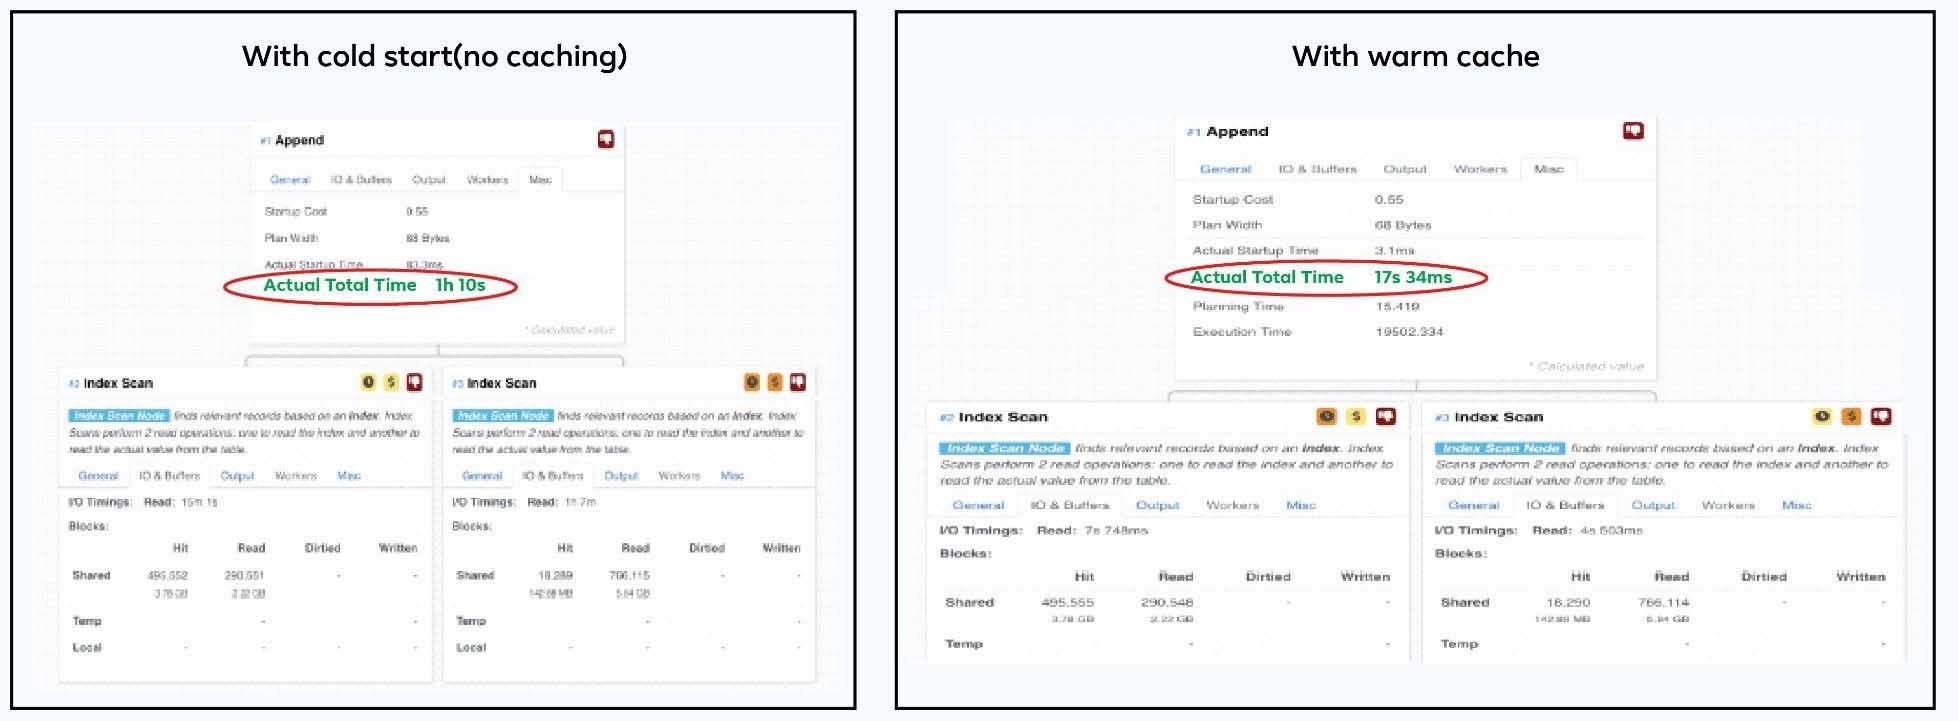
Explain plan is not estimating OS cache effect properly ?
Explain is good in giving shared_buffers stats but it can not give you accurate OS cache usage stats . For one of our production reports(different than the one cited above) , we ran the explain plan for warm cache and cold cache scenarios. You can see that the cold cache scenario took more than an hour to complete where as the warm cache scenario took few seconds .. But nowhere in the explain it reflects the OS cache benefit ( Buffers numbers are almost same but the query only took seconds with warm cache)
How to accurately study OS cache effect for a query - Procid technique?
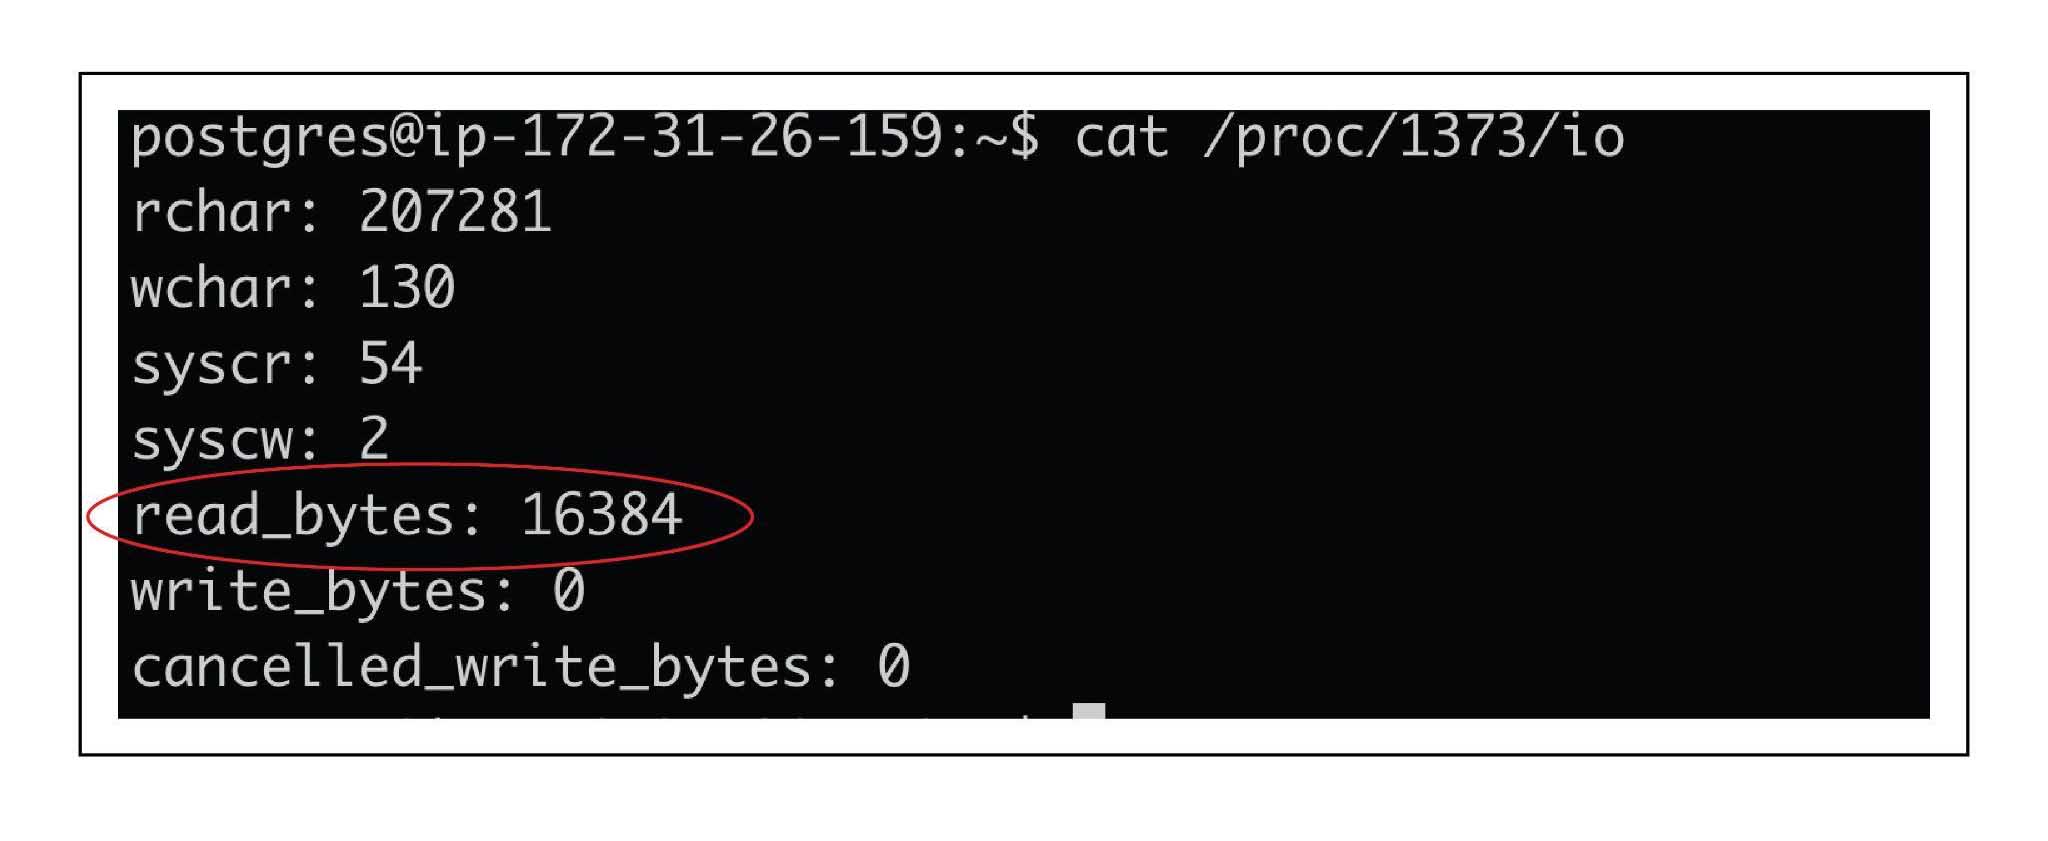
So if explain plan is not reflecting true OS cache stats , what else can be used to accurately measure OS cache effects ? You can check output of “Cat /proc/<<procid>>/io” when the query runs and see the difference in read_bytes . You need to replace the procid in below command with your backend pid and this needs to be gathered when the query is in progress. This will give you data about the amount of data read from disk and you can calculate benefit of OS cache roughly using those numbers
Cat /proc/<<procid>>/io (replace by your backend pid)
For above detailed scenario , we captured these stats and as you can see to begin with read_bytes was 16384
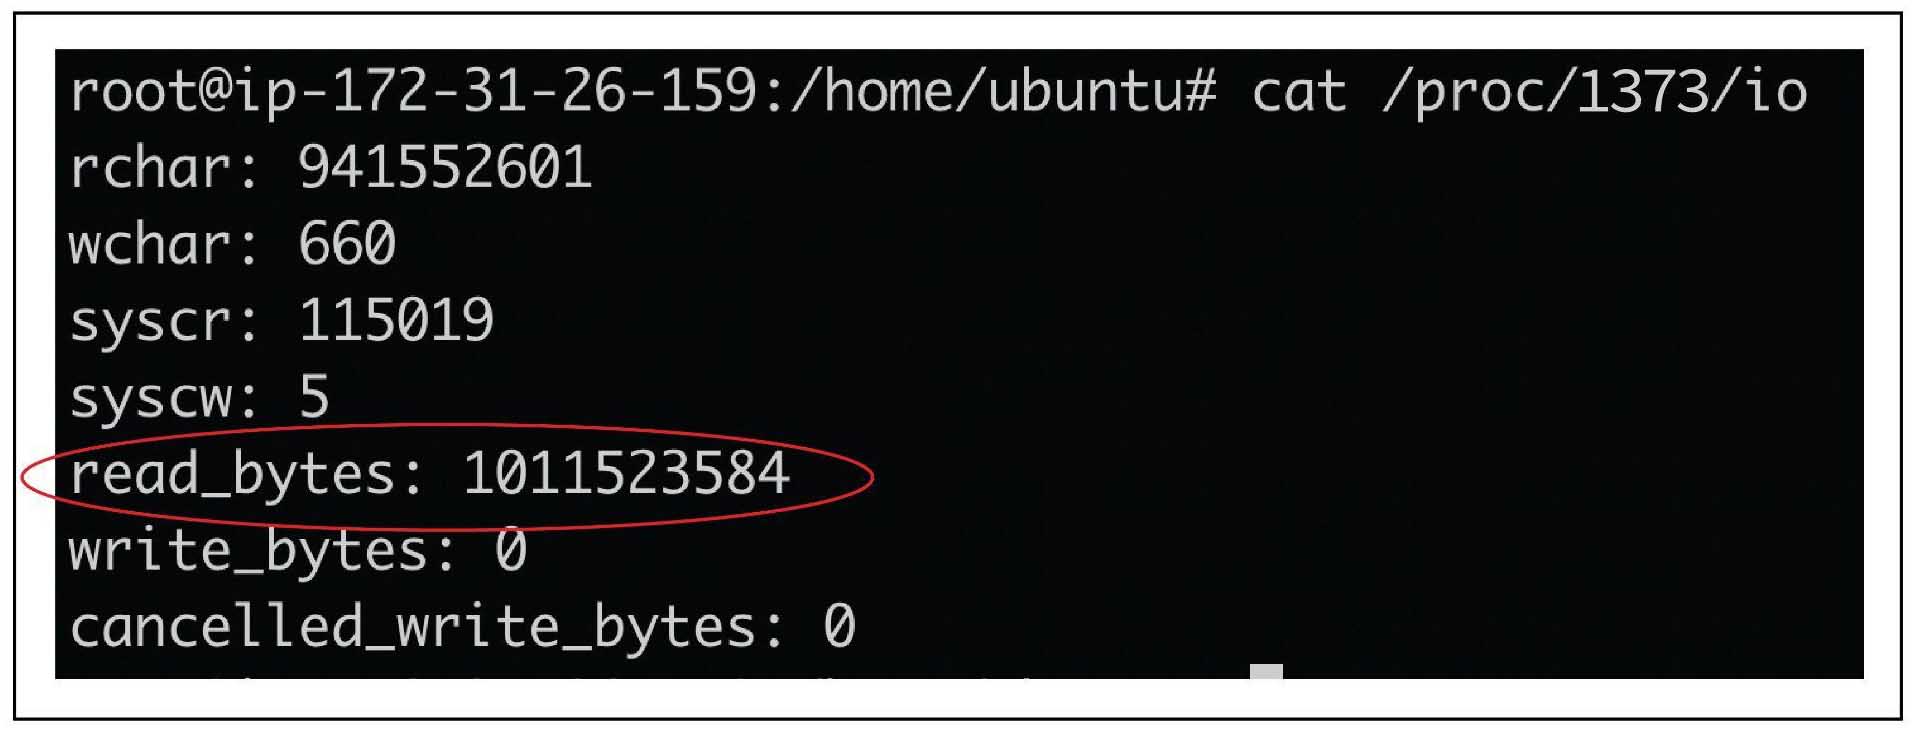
Once the query is completed you can see that the read_bytes incremented to a very large value
Conclusion
Using pgfincore and pg_buffercache can be extremely beneficial in troubleshooting performance issues . Please take extra caution when you use pgfincore to restore a state , thoroughly test for your use case before using these methods in production(In our case it was a reporting server and not a mission critical OLTP server , Restoring cache state can adversely impact performance in some cases ).Check our other performance articles – Pgbouncer multiple instances(How we increased our TPS using multiple instances) , Postgres and temporary files , Pgpool and performance tuning, How we improved Lambda performance by 130x etc..
Looking for Postgres support ? Please reach us at support@klouddb.io