NOTE : This is PART 3 of series. Please go to our blog section and read PART 1 and 2 (If you have not done that already)
Working Example:
Let’s understand this with an example through sysbench. Example below creates single sysbench table and runs updated benchmark on it.
sysbench --threads=1 --db-driver=mysql --db-ps-mode=disable --mysql-host=localhost --mysql-port=3306 --mysql-socket=/tmp/mysql.sock --mysql-user=root --mysql-password='' --mysql-db=test prepare --test=/usr/share/sysbench/oltp_insert.lua --tables=1 --table_size=1000 prepare

sysbench --threads=1 --time=120 --db-driver=mysql --db-ps-mode=disable --report-interval=1 --mysql-host=localhost --mysql-port=3306 --mysql-socket=/tmp/mysql.sock --mysql-user=root --mysql-password='' --mysql-db=test prepare --test=/usr/share/sysbench/oltp_update_index.lua --tables=1 --table_size=1000 run
Another independent transaction is started as follows. (Note: this transaction is purposely kept open to show the effect on rollback segments)
BEGIN; SELECT COUNT(*) FROM sbtest1; UPDATE t SET c = ‘NEW DATA’ WHERE i = 10;...<<<>>>
Now we can start tracking rollback segment or history length growth by monitoring it here:
mysql> SELECT NAME, COUNT FROM INNODB_METRICS WHERE NAME LIKE "%history%";
+----------------------+-------+
| NAME                 | COUNT |
+----------------------+-------+
| trx_rseg_history_len | 15067 |
+----------------------+-------+
1 row in set (0.00 sec)
So with this simple workload we can see there history length has grown to 15K. This is because the said culprit transaction is holding read-view that needs old version of the rows (from sbtest1) and so the update undo logs needs to be maintained.
Follow-up Question ?
There are only 1K rows in the table but undo log segments > 15K. How come ? Assuming even if all rows were touched by the workload it should have max 1K undo log segments.
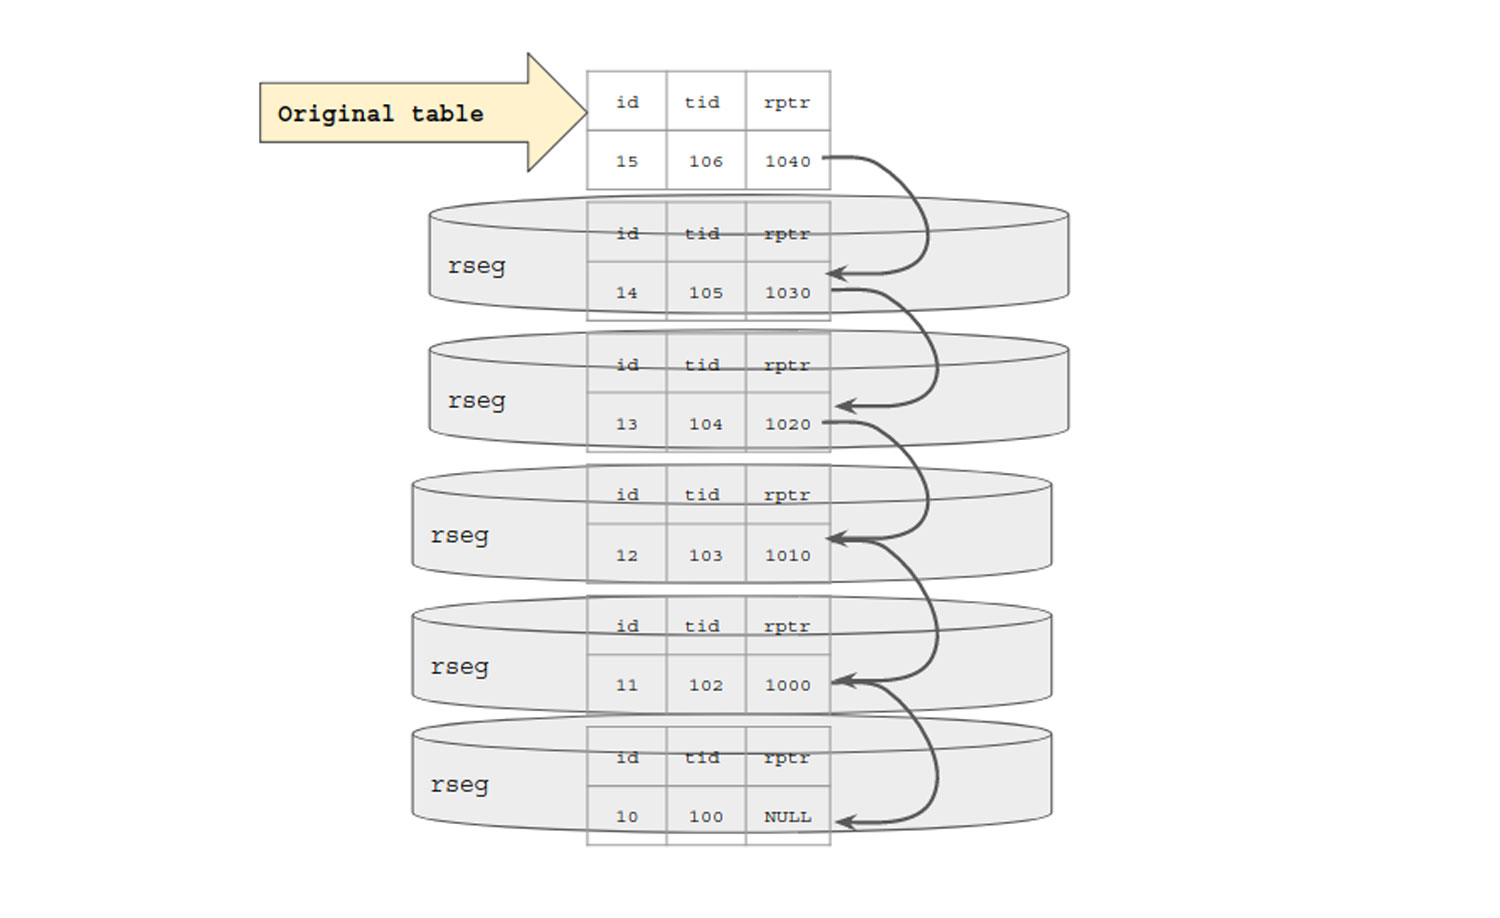
Let’s quick refresh what we seen above. When a row is updated, its old version is backed up and reference to this old version is then maintained with help of db-roll-ptr.
Say N different transactions tend to modify same row N different times. (update t set i = i +1 where i = 10;)
Each time a row is updated, with new transaction, old version is copied over to respective rollback-segment with pointer to it. Check the diagrammatic representation below. So even if single row is being modified in the case below, each transaction will create its own update undo rollback segment this would eventually pile up to N rollback segments. If an independent transaction has created read-view based on most old copy that is trx-id = 100 then it needs to traverse over all N size linked list of db-roll-ptr to get the original data. It can’t simply jump to it since reference is sequentially stored in form of list (as depicted below).

So we got the answer to our question. Why is history length > 1K when table has 1K rows only. But this now opens up another question.
More Follow-up Questions ?
A simple select that may take trivial time, now takes significant time to traverse over this list to reach the oldest version. This gets bad if buffer pool has to flush these undo segments and on demand re-read them from the disk.
- No such generic limit that works for all could be defined as every use-case is different. Say in use-case-1, trx is modifying a char (200) column. This would end-up generating bigger undo segment footprint with N transactions vs use-case that is trying to modify integer column (4 bytes) given the size difference.
- Also, it depends lot on how big is buffer pool, what other parallel transaction are being done.
- But in general history length growing to few thousand is not a big issue but user/admin should keep a watch on it.
Understanding effect on performance with simple test
I am using simple test so that is easy to show that effect on trivial queries too.
We will use the same sysbench workload as shown above just that we will increase the number of rows from 1K to 1M. Parallely we will also start a read-only transaction that will do a simple select on the said table thereby causing generation of the read-view.
Snapshot-1:
1. Start server with smaller innodb buffer pool (32M) size to get an effect of undo log being flushed out of memory.
2. Start an independent read only transaction. Note the time select is taking at the start of transaction.
mysql> begin;
Query OK, 0 rows affected (0.00 sec)

mysql> select count(*) from sbtest1 where id > 100 and id < 10000000;
+----------+
| count(*) |
+----------+
|   999900 |
+----------+
1 row in set (0.34 sec)
3.Capture history length at the start
mysql>  SELECT NAME, COUNT FROM INNODB_METRICS WHERE NAME LIKE "%history%";
| NAME                 | COUNT |
+----------------------+-------+
| trx_rseg_history_len |  4707 |
+----------------------+-------+
1 row in set (0.00 sec)
4. Now let’s start the update workload for 600 secs with 4 threads.
5. Once the workload is complete check the size of history length.
mysql> SELECT NAME, COUNT FROM INNODB_METRICS WHERE NAME LIKE "%history%";

+----------------------+--------+
| NAME                 | COUNT  |
+----------------------+--------+
| trx_rseg_history_len | 167407 |
+----------------------+--------+

1 ROW IN SET (0.00 sec)
6. So history length has increases from 4K to 167K. For practical purpose 167K may not be a big value but we have purposely scale down the setup for easy reproducibility.
7. Check the size of undo logs. Size of undo > 32M that is buffer pool size so some part of undo log is surely flushed to disk.
37M undo_001
37M undo_002
8. Now let’s fire the select query from the independent transaction one more time:
mysql> SELECT COUNT(*) FROM sbtest1 WHERE id > 100 AND id < 10000000;

+----------+
| COUNT(*) |
+----------+
| 999900   |
+----------+

1 ROW IN SET (1.31 sec)
9. So the timing for SELECT has gone up from 0.32 -> 1.31 that is 4x increase in query time that too for a really trivial query. If we fire the same query from another independent session that doesn’t have read-view created (so will fetch latest value) the time it reports is 0.32 seconds.
10. Now let’s also confirm that there was disk read involved for this undo log activity.
Before firing the query from read-view transaction.
mysql> SHOW GLOBAL STATUS LIKE 'Innodb_buffer_pool_reads';

+--------------------------+--------+
| Variable_name            | VALUE  |
+--------------------------+--------+
| Innodb_buffer_pool_reads | 770565 |
+--------------------------+--------+

1 ROW IN SET (0.01 sec)
Lorem ipsum dolor sit amet, consectetur adipiscing elit. Ut elit tellus, luctus nec ullamcorper mattis, pulvinar dapibus leo.
After firing the query from read-view transaction. (110K page reads).
mysql> SHOW GLOBAL STATUS LIKE 'Innodb_buffer_pool_reads';

+--------------------------+--------+
| Variable_name            | VALUE  |
+--------------------------+--------+
| Innodb_buffer_pool_reads | 770565 |
+--------------------------+--------+

1 ROW IN SET (0.01 sec)
Snapshot-2:
Keeping the setup same as before let’s increase the buffer pool size to see the effect.
With increase buffer pool size (1G) there is no need to flush undo log or re-read it from disk.
This too increased the time needed for SELECT by 7X.
mysql> SELECT COUNT(*) FROM sbtest1 WHERE id > 100 AND id < 10000000;

+----------+
| COUNT(*) |
+----------+
| 999900   |
+----------+
1 ROW IN SET (0.25 sec)

mysql> SELECT COUNT(*) FROM sbtest1 WHERE id > 100 AND id < 10000000;
+----------+
| COUNT(*) |
+----------+
| 999900   |
+----------+

1 ROW IN SET (0.42 sec)
We can continue to try more variation but the bottom line is increasing history length is bad for SELECT performance.
Suggested Fix:
1. Tuning purge lag
- Tune innodb_max_purge_lag. This variable defines a threshold for history length. If history length goes beyond the said threshold then it will simply start delaying upcoming UPDATE transaction by X micro-seconds.
- Let’s first see the effect of this and then discuss if the said solution really solves the issue.
- We will set innodb_max_purge_lag to 50K. Once history length crosses 50K it will start to delay the upcoming transactions.
- MySQL-8.0.14 onwards the delay has been reduced to 5 microseconds. Considerable low to observe any major effect.
- Till MySQL-8.0.14 it was set to 5000 microseconds (minimum) this reduces throughput to 67%.
TPS with purge_lag (innodb_max_purge_lag_delay=5000)
transactions: 4367 (218.25 per sec.)
TPS without purge lag set
transactions: 6460 (322.76 per sec.)
- As expected setting innodb_max_purge_lag causes overall DML performance to go down. This is not a design issue but user opted solution. Unfortunately, that is the one of the suggested solution for keeping history length under check. Also, it works on optimistic assumption that if there is long-running transaction then it would complete by then.
- While the said solution may help to keep history length in check it surely doesn’t solve the problem.
- So in next section we will see how to trace the culprit transaction so that DBA can take a call to kill or re-inspect the said transaction.
2. Finding the culprit transaction
- So based on analysis above we discovered that setting purge_lag will slow down the main workload. Our next attempt is to check the transaction that is causing the history length to grow.
- INNODB_TRX table list all the open transactions including the read-only transactions. From the output below we can see that there are multiple active transactions. Sparing DML transactions we also see a transaction that is active for last 13 mins and though currently not executing any query may be holding the read-view that is causing the history length to grow.
mysql> SELECT trx_id, trx_state, trx_started, trx_query, trx_mysql_thread_id FROM INNODB_TRX;

+-----------------+-----------+---------------------+-----------------------------------------+---------------------+
| trx_id          | trx_state | trx_started         | trx_query                               | trx_mysql_thread_id |
+-----------------+-----------+---------------------+-----------------------------------------+---------------------+
| 449738          | RUNNING   | 2019-03-19 18:08:41 | UPDATE sbtest1 SET k=k+1 WHERE id=50491 |                  22 |
| 449737          | RUNNING   | 2019-03-19 18:08:41 | UPDATE sbtest1 SET k=k+1 WHERE id=49957 |                  24 |
| 449736          | RUNNING   | 2019-03-19 18:08:41 | UPDATE sbtest1 SET k=k+1 WHERE id=34932 |                  21 |
| 449732          | RUNNING   | 2019-03-19 18:08:41 | UPDATE sbtest1 SET k=k+1 WHERE id=32834 |                  23 |
| 422011763423056 | RUNNING   | 2019-03-19 17:40:43 | NULL                                    |                  10 |
+-----------------+-----------+---------------------+-----------------------------------------+---------------------+

5 ROWS IN SET (0.00 sec)
- Now using the last column (trx_mysql_thread_id which is actually processlist id) one can find out from performance schema (default enabled in 8.0 onwards) which all queries has been fired from the said session. Reverse scan be done to identify the last open transaction.
mysql> select sql_text from events_statements_history where thread_id = (select thread_id from threads where processlist_id = 10) order by event_id;
+---------------------------------------------------+
| sql_text                                          |
+---------------------------------------------------+
| select @@version_comment limit 1                  |
| SELECT DATABASE()                                 |
| NULL                                              |
| show databases                                    |
| show tables                                       |
| NULL                                              |
| begin                                             |
| select count(*) from sbtest1 where id < 100000000 |
+---------------------------------------------------+
8 rows in set (0.00 sec)
- Depending on the whether the transaction is really active (or left-out) user can decide the next course of action.
- Say we identified the culprit transaction. Let’s check the history length and then immediately commit the transaction (or kill it).
mysql> SELECT NAME, COUNT FROM INNODB_METRICS WHERE NAME LIKE "%history%";

+----------------------+--------+
| NAME                 | COUNT  |
+----------------------+--------+
| trx_rseg_history_len | 224410 |
+----------------------+--------+

1 ROW IN SET (0.01 sec)
Once the read-view is released with few seconds (depending on the load) undo-segments are purged.
mysql> SELECT NAME, COUNT FROM INNODB_METRICS WHERE NAME LIKE "%history%";

+----------------------+-------+
| NAME                 | COUNT |
+----------------------+-------+
| trx_rseg_history_len |   0   |
+----------------------+-------+

1 ROW IN SET (0.00 sec)
3. Alternative to find culprit transaction
- Other alternative to trace the culprit transaction is through “SHOW ENGINE INNODB STATUS”. The only shortcoming of this is it doesn’t list the read-only transaction. But if the said read-only transaction turns read-write then one can trace the information through this command.
- Command also list the read-view visibility range like one we explained above.
• mysql tables in use 1, locked 1
• 2 lock struct(s), heap size 1136, 1 row lock(s), undo log entries 1
• MySQL thread id 27, OS thread handle 140536632923904, query id 261430 localhost root waiting for handler commit
• UPDATE sbtest1 SET k=k+1 WHERE id=36241
• mysql tables in use 1, locked 1
• 2 lock struct(s), heap size 1136, 1 row lock(s), undo log entries 1
• MySQL thread id 26, OS thread handle 140536632342272, query id 261429 localhost root waiting for handler commit
• UPDATE sbtest1 SET k=k+1 WHERE id=50469
• mysql tables in use 1, locked 1
• 2 lock struct(s), heap size 1136, 1 row lock(s), undo log entries 1
• MySQL thread id 25, OS thread handle 140536632051456, query id 261428 localhost root waiting for handler commit
• UPDATE sbtest1 SET k=k+1 WHERE id=50189
• 2 lock struct(s), heap size 1136, 1 row lock(s), undo log entries 1
• MySQL thread id 10, OS thread handle 140536663537408, query id 260980 localhost root
• Trx read view will not see trx with id >= 450427, sees < 450427
Multi-table DML workload
- To simplify the tracking and understanding we have used single table workload above. All of that shown above is applicable to multi-table workload too but there is one setting that you should care about.
- innodb_purge_threads: As name suggest it dictates number of purge thread to create for purging action.
- With multi-table dml and multiple independent read-views if multiple transaction releases read-view then having more than one purge thread can help accelerate the process.
Setup
sysbench --threads=12 --db-driver=mysql --db-ps-mode=disable --mysql-host=localhost --mysql-port=3306 --mysql-socket=/tmp/mysql.sock --mysql-user=root --mysql-password='' --mysql-db=test prepare --test=/usr/share/sysbench/oltp_insert.lua --tables=12 --table_size=5000000 prepare
(Created footprint of 25G on disk. Buffer pool size = 1G. Expecting lot of disk read/write).
Start a read-write workload followed by a read-only workload that takes significant time.
sysbench --threads=4 --time=0 --db-driver=mysql --db-ps-mode=disable --report-interval=1
--mysql-host=localhost --mysql-port=3306 --mysql-socket=/tmp/mysql.sock --mysql-user=root --mysql-password='' --mysql-db=test prepare
--test=/usr/share/sysbench/oltp_update_index.lua --tables=12 --table_size=5000000 run

sysbench --threads=4 --time=0 --db-driver=mysql --db-ps-mode=disable --report-interval=1
--mysql-host=localhost --mysql-port=3306 --mysql-socket=/tmp/mysql.sock --mysql-user=root --mysql-password='' --mysql-db=test prepare
--test=/usr/share/sysbench/oltp_read_only.lua --point_selects=10 --simple_ranges=1000 --range_size=100000 --sum_ranges=1000 --distinct_ranges=1000
--tables=12 --table_size=5000000 run

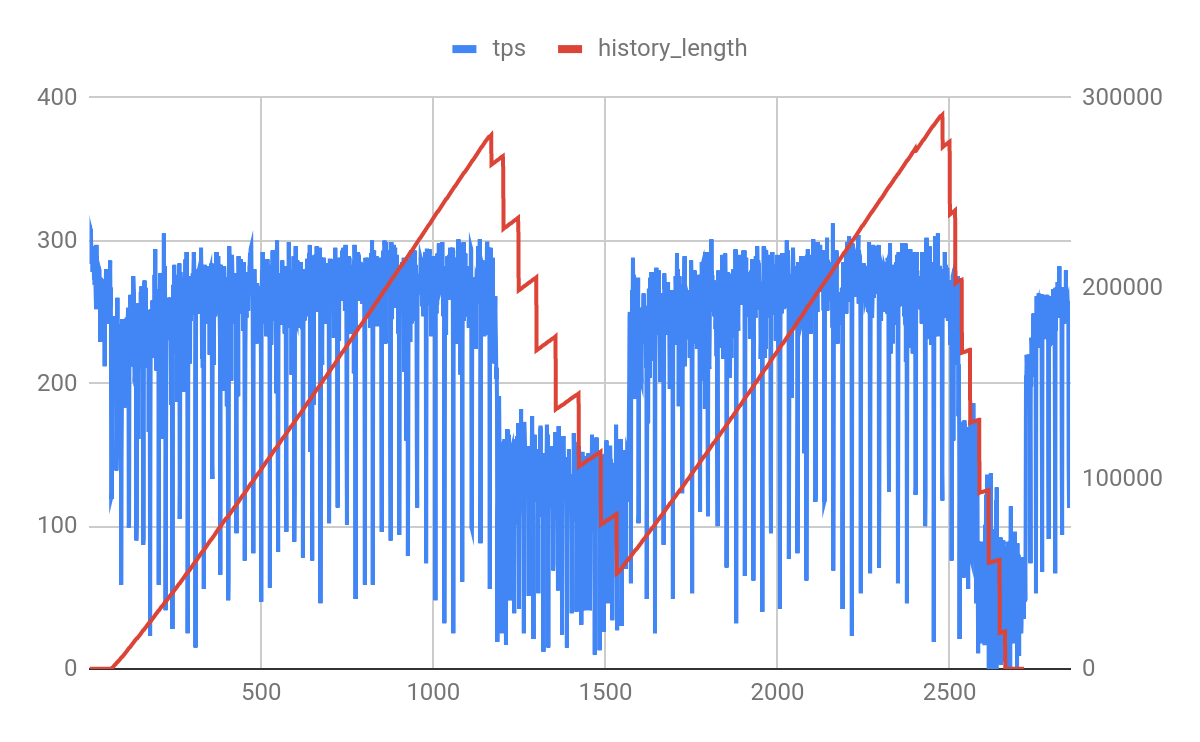
We got a interesting graph.
- X-axis represent time for which workload was executed. (around 2700 seconds).
- Y-left-axis represents DML read-write tps
- Y-right-axis represents history length
Observations:
- History length continue to grow. This is because of presence of the long running read-only transaction.
- After say approx 1100+ seconds, history length continue to slide. This is time when these 4 read-only transactions triggered through sysbench commits.
- When this happens DML workload throughput is downtown to almost half. (280 -> 150)
- It takes roughly took 400 seconds to cleanup the overhead created. During this 400 seconds DML workload is affected because background purge is active. Note: history length during first slide doesn’t goes to 0 because read-only workload is still active. During 2nd slide it goes close to 0 as read-only workload was aborted (post 2nd commit).
- Once again undo log segments continue to start piling up as 2nd batch of read-only transactions starts.
- Did you noticed the flat history length at the start that indicate only R-W workload is active during those initial seconds. We purposely added read-only workload like post 60 seconds to showcase this behavior.
Variation (effect of innodb_purge_threads)
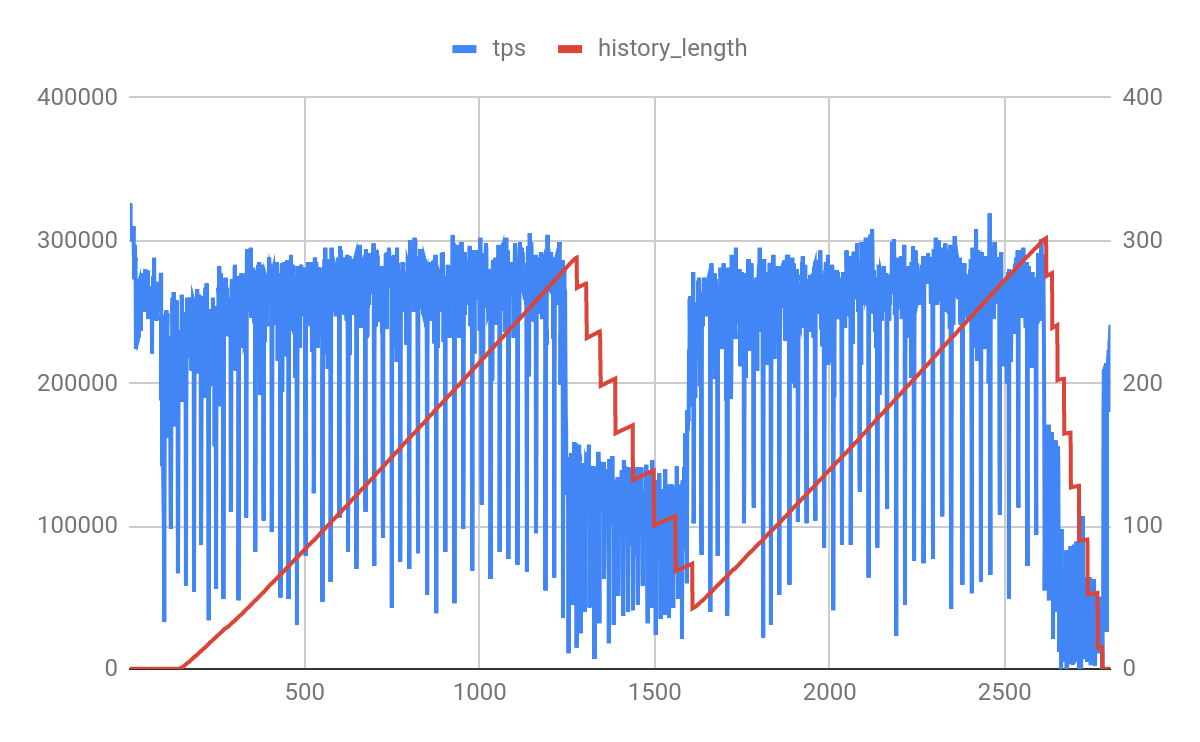
We ran same experiment with innodb_purge_threads=4 with hope that it would reduce the cleanup time from 400 seconds to something less but looks like with load active, it is not able to accelerate this efforts. This could be also due to CPU and IO contention.

For completeness let me quote there is innodb_purge_batch_size that can be tuned to configure load each purge thread get while purging. As recommended by MySQL user should avoid tuning it unless needed or understand the effect.
