
Table of Contents
Problem description - Initial latency numbers
With the advent of cloud, people are using lambda functions to automate repetitive tasks . You can use python , node js etc .. as a programming language for your lambda function . Writing function is one thing but getting it to work optimally can be challenging sometimes . We are presenting a performance tuning scenario where we increased Lambda performance by more than 130X (130 times) – 30,000 ms(before tuning) Vs 230 ms(after tuning)
Our lambda function does bunch of inserts every few seconds and initially it was taking around 30 seconds and generating lot of errors . We are using Postgres as our backend server for this service
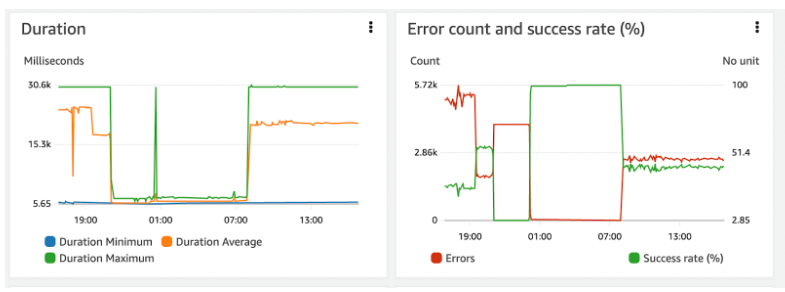
Below are the initial performance numbers. As you can see it was taking a max of 30 seconds for each execution and there were lot of errors ( Please ignore the part of graph where the latency was good in between – that was because there were fewer invocations and a restart of ingestion task)
Region change - Make sure your backend is in the same region
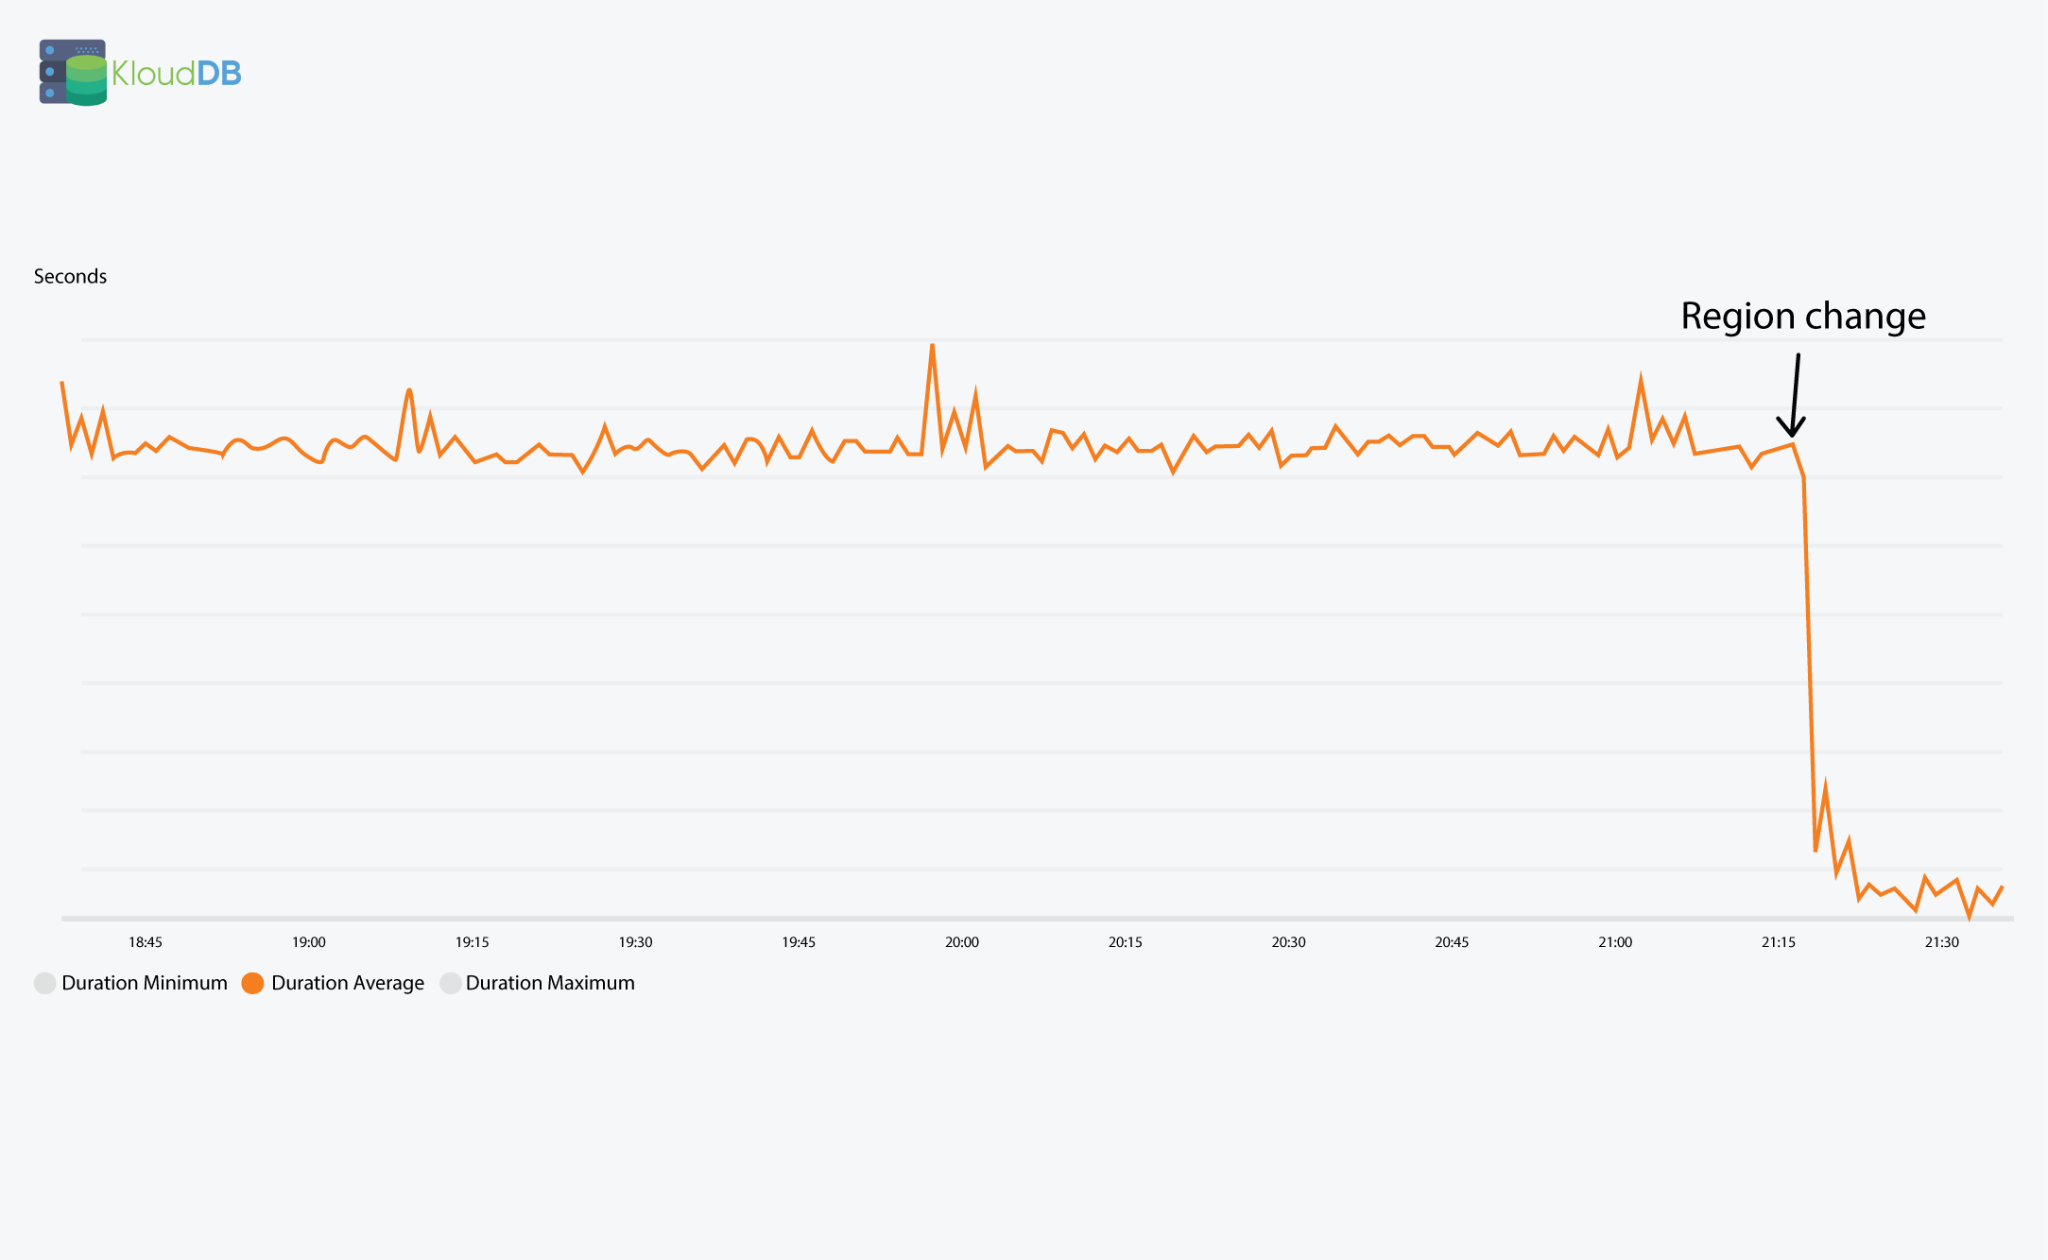
Initially our backend server was in Ohio region whereas our Lambda function was in California region , Once we shifted our postgres server to California region , average duration went down to 15 seconds (earlier it was 30 seconds )
Below diagram depicts the latency improvement after this change
How do you find where the time is being spent in Lambda ? Time breakdown will help in identifying the root cause
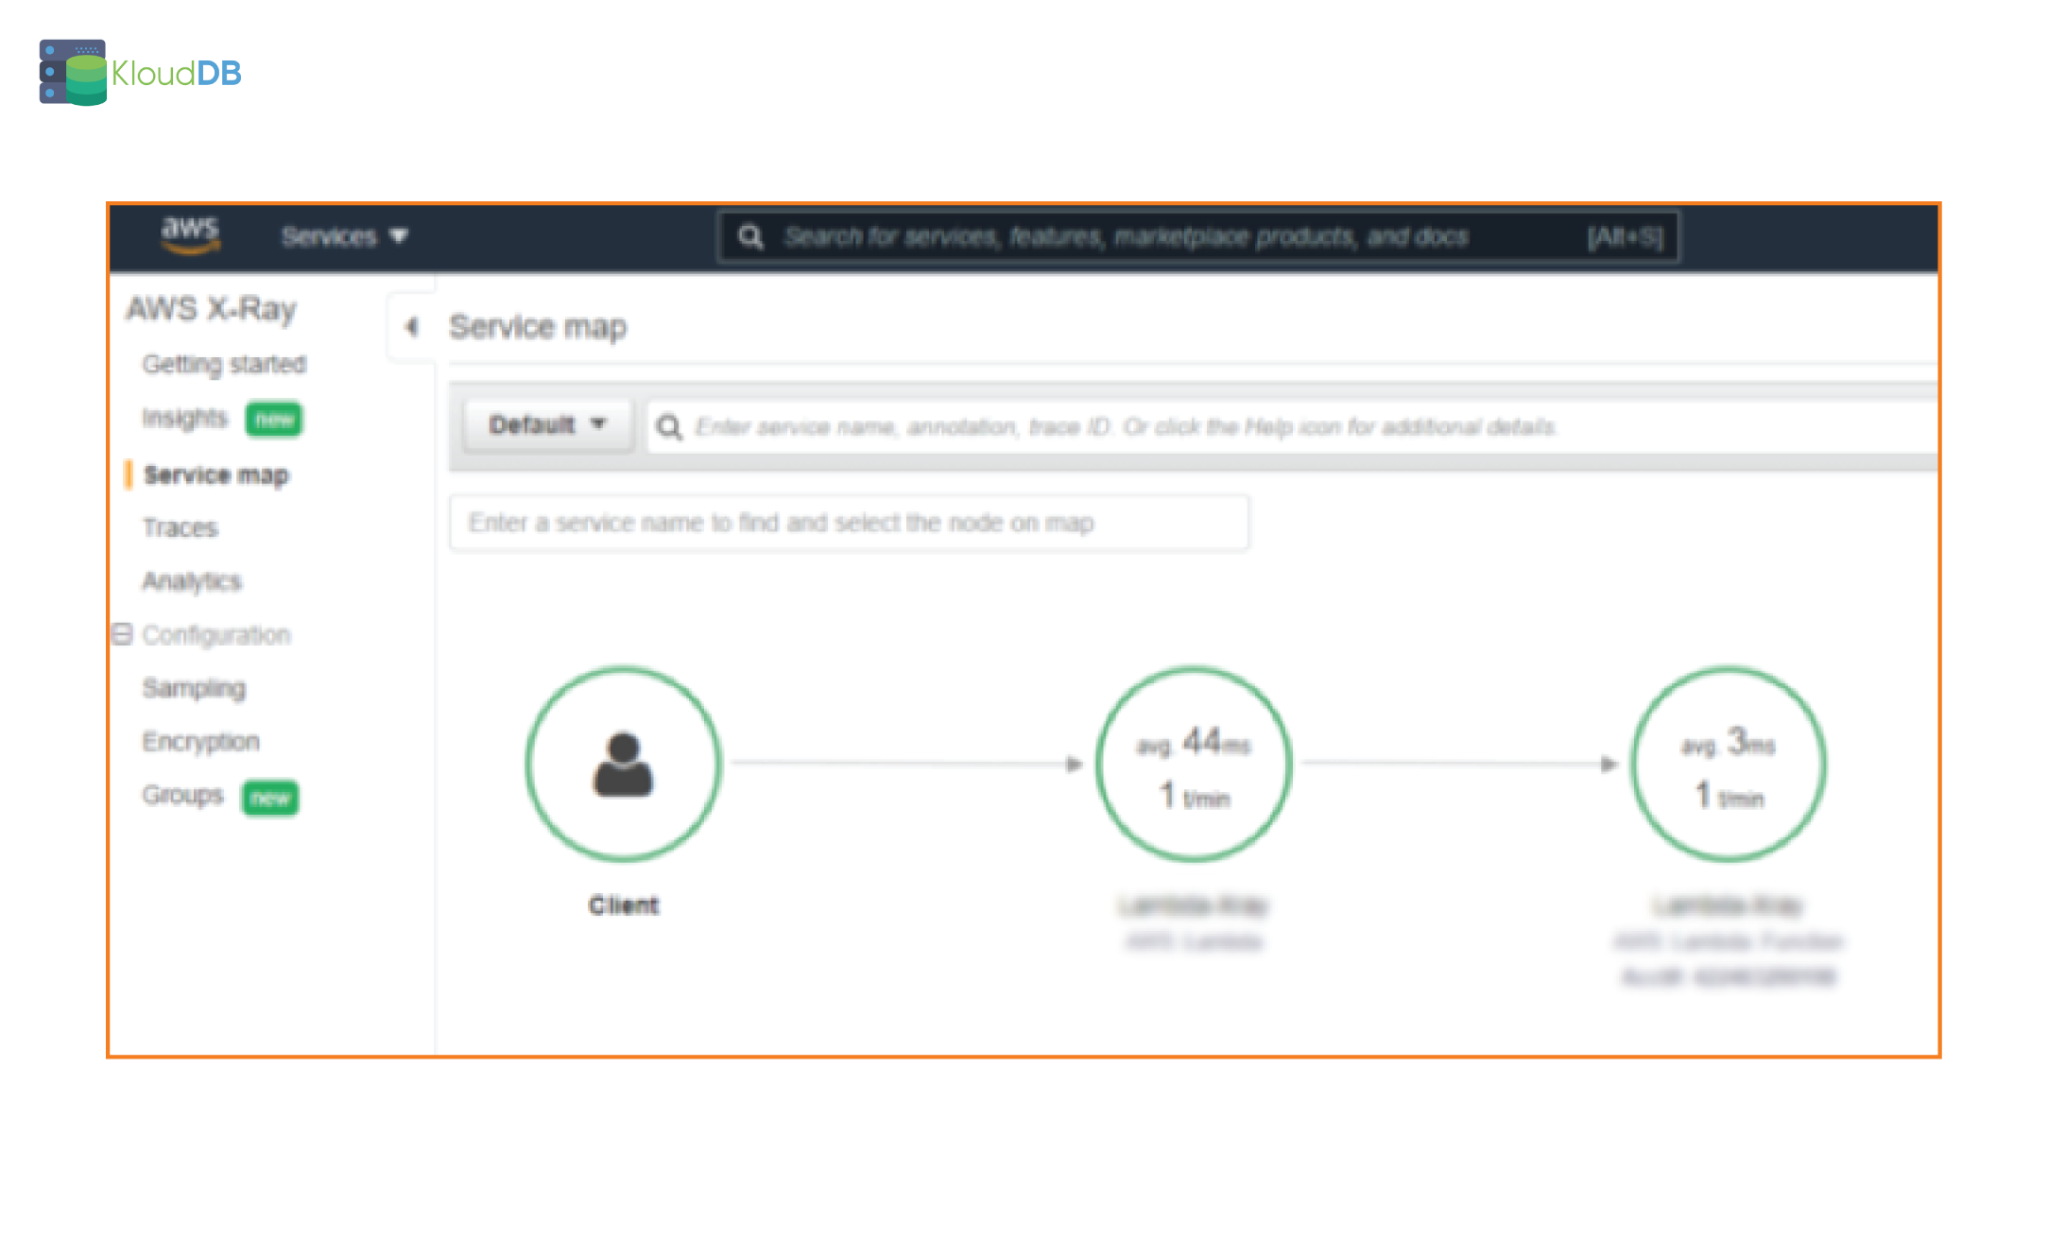
AWS x-ray is a tracing feature that can give you the breakdown – Time taken at each stage of execution. You can enable it by going to ‘configuration section’ of your lambda function . By default active tracing is not enabled and you can enable it to see the visual map
Once you enable active tracing you will be able to see a service map like below (NOTE – This is a sample image for your reference and not the one from our tests)
Lambda is closing the connection properly ?
One other issue we faced is about connection management . Depending on your runtime (Nodejs/python/..) please make sure that you are closing and managing connections properly . In postgres creating too many unwanted connections can add lot of overhead(using pgbouncer/pgpool can help)
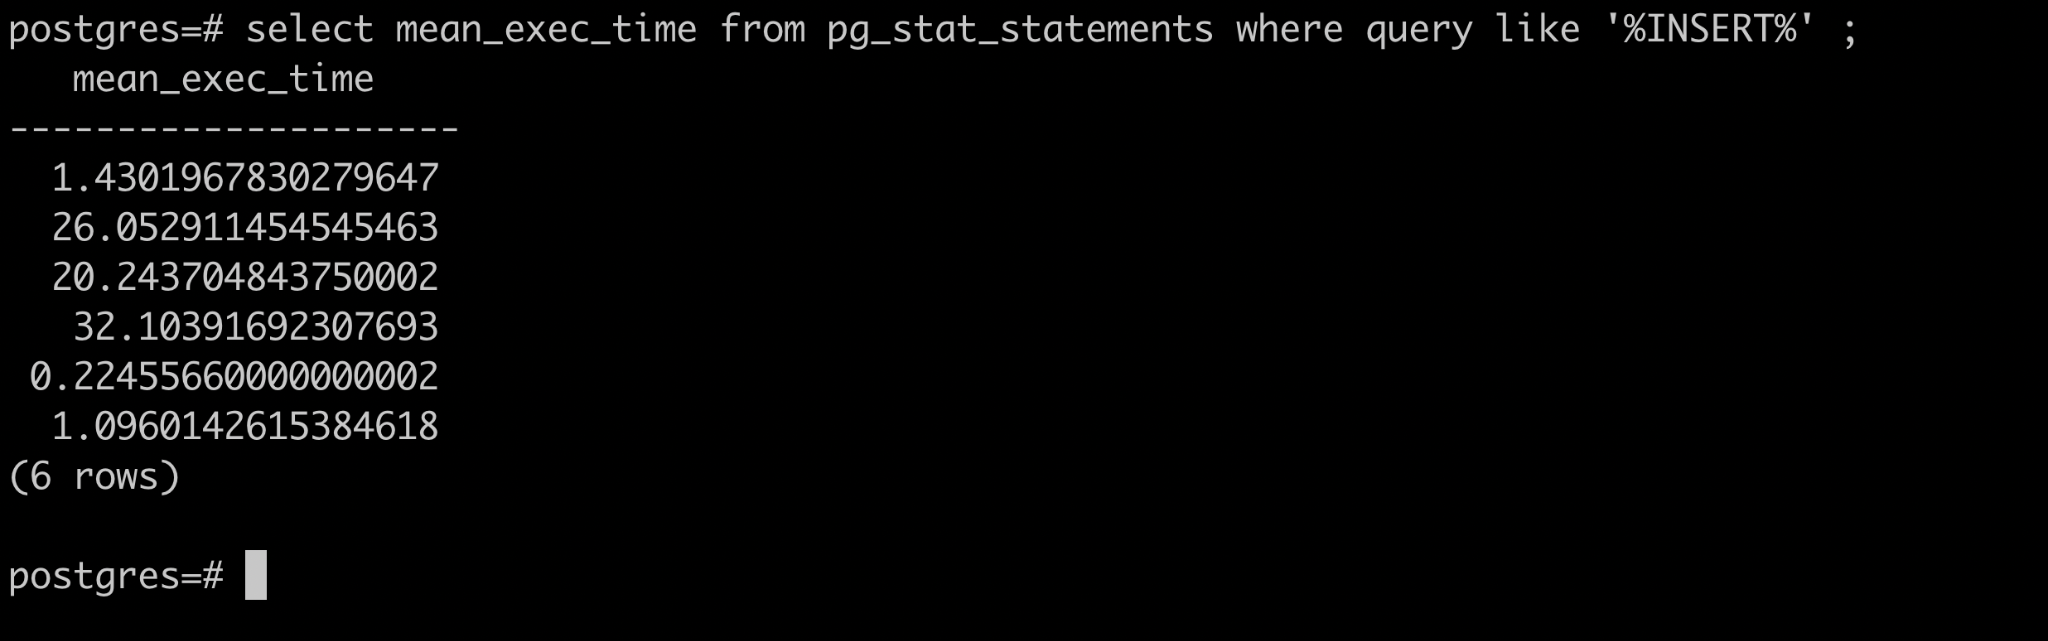
As our lambda function was doing frequent inserts , we wanted to check the mean exec time of inserts . As you can see below our inserts were doing fine (0.2 to 32 milliseconds). While the total lambda was taking 15 seconds , inserts only took few milliseconds
Next thing we noticed is lot of idle connections .We fixed our lambda to close the connections properly and not to create unwanted connections . We also added pgbouncer to pool connections
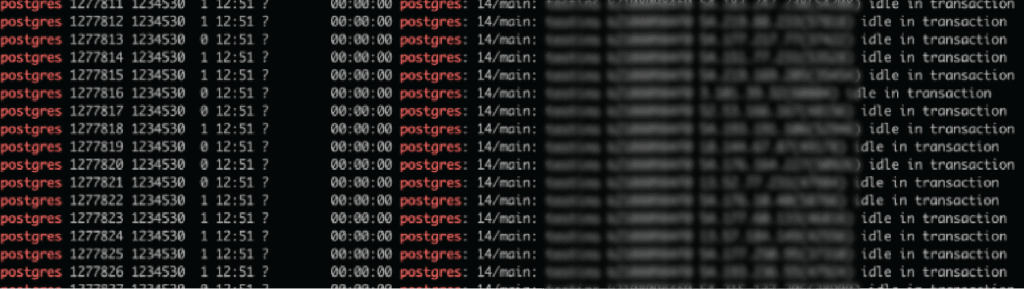
Other clue came from below stats , Lot of sessions were being abandoned which is not good
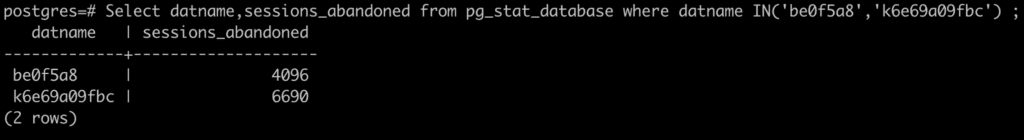
Please note that you can use parameters like idle_session_timeout etc.. to control this behavior NOTE: When you set idle_session_timeout at global level you have to be extremely careful not to impact your needed application sessions .
One other thing we did is to merge multiple inserts into one single statement which helped in reducing the overhead
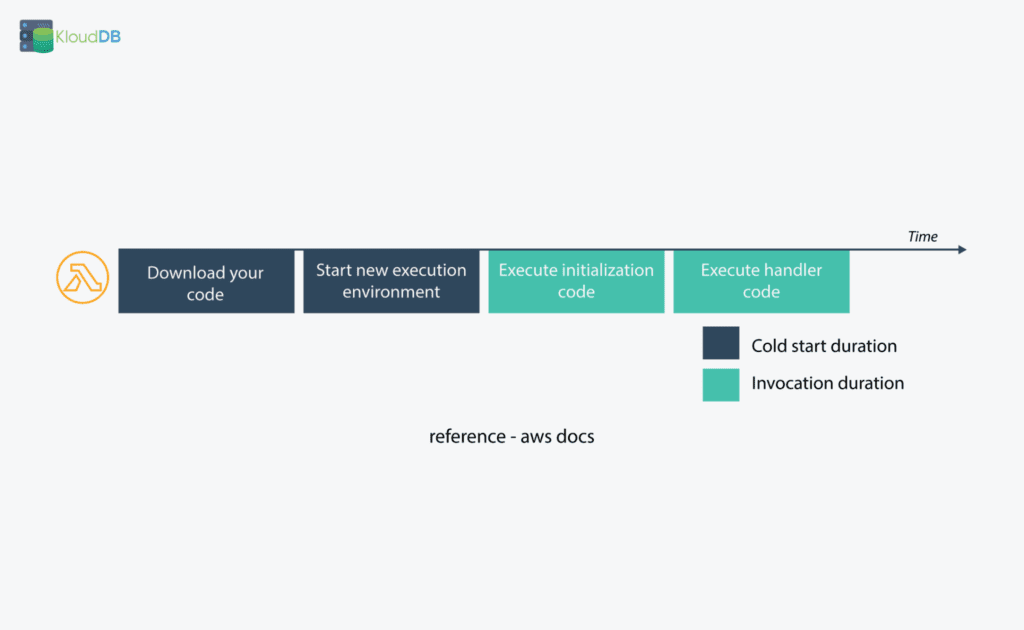
Cold starts can be a problem
When a lambda function is invoked , it internally downloads the code from s3 and prepares a runtime environment before actually executing the code . This stage is defined as “cold start” . Repetitive executions of the same lambda functions will reuse the environment and this is called as “warm start” . Ideally we want to see as less cold starts as possible
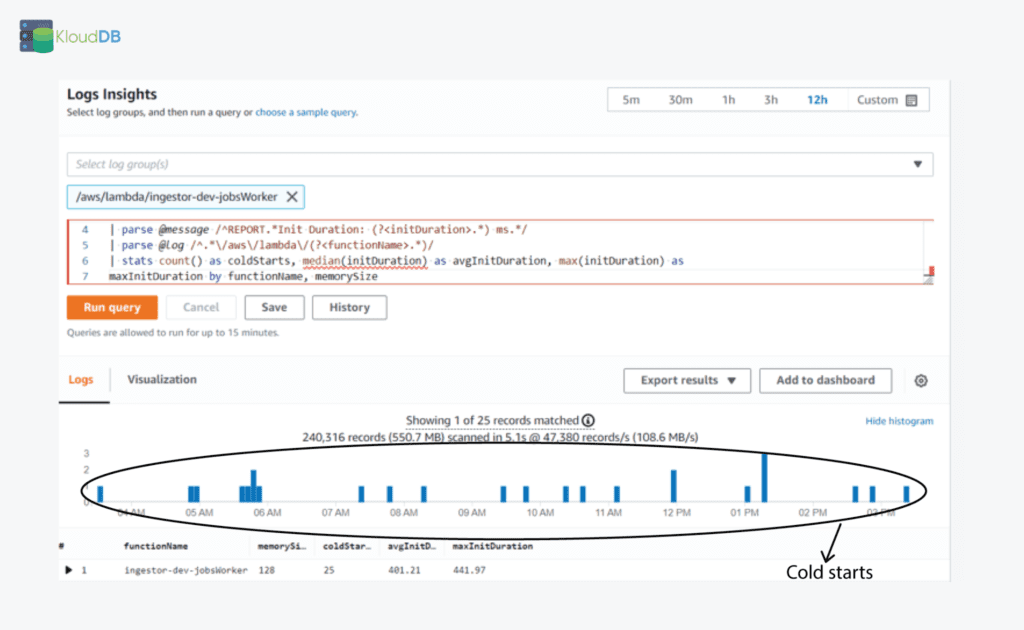
You can use below query (Log insights query) to see if cold starts are happening
filter @type="REPORT" | fields @memorySize / 1000000 as memorySize | filter @message like /(?i)(Init Duration)/ | parse @message /^REPORT.*Init Duration: (?.*) ms.*/ | parse @log /^.*\/aws\/lambda\/(? .*)/ | stats count() as coldStarts, median(initDuration) as avgInitDuration, max(initDuration) as maxInitDuration by functionName, memorySize
Query source – AWS docs
In our case cold starts are happening sometimes (below is the screenshot for 12 hour range) . If you are seeing excessive cold starts , you should address this on an urgent basis . You can fix cold starts by having provisioned concurrency and other methods
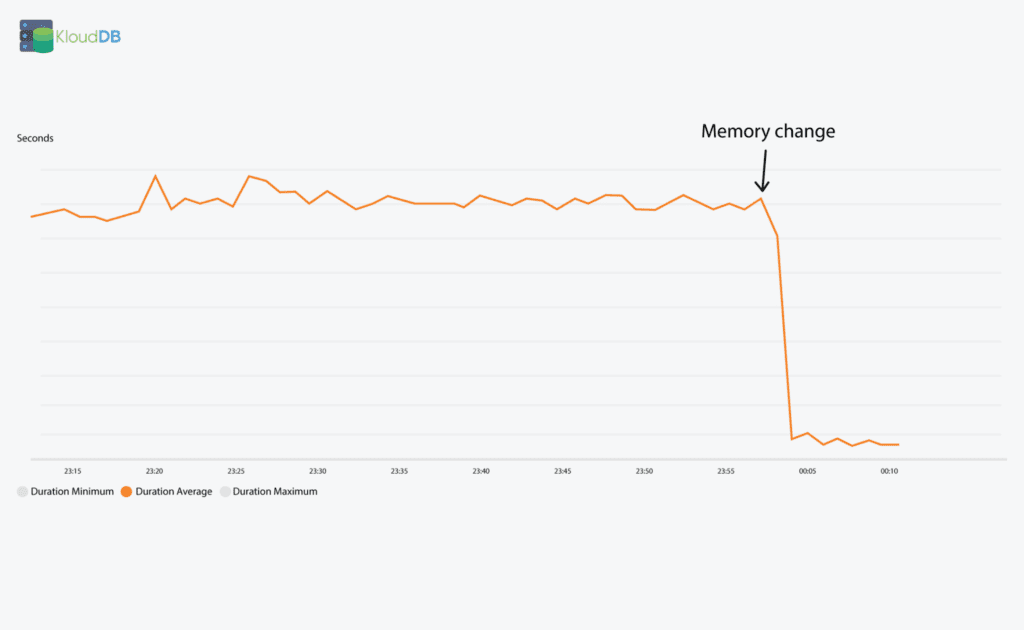
Memory and computing power
You can configure the amount of memory allocated to a Lambda function, between 128 MB and 10,240 MB
In our case the default was 128 MB and changing it to suit our needs helped . You can also leverage https://github.com/alexcasalboni/aws-lambda-power-tuning to tune your memory/compute power settings
After changing it to 512 MB there was huge improvement (as shown below)
Cloudwatch logs - Check for errors
You can run cloudwatch log reports to check for errors etc..
You can check average latency using something like below
filter @type = “REPORT”
| stats avg(@duration), max(@duration), min(@duration)
by bin(5m)
You can check for errors using something like below
fields Timestamp, LogLevel, Message
| filter LogLevel == “ERR”
| sort @timestamp desc
| limit 100
Throttling issues
Sometimes you might notice throttling issues as seen below
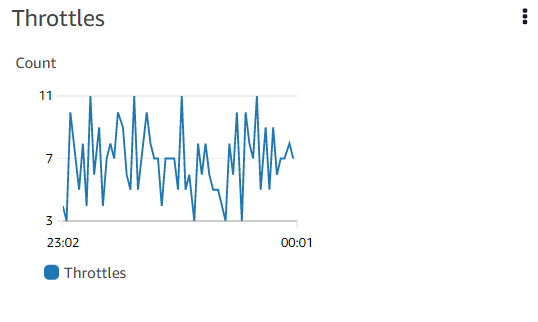
In our case originally we set a low value for reserved concurrency and increasing it helped us . Please set these values according to your needs . Also there is account level global concurrency limits that might trigger throttles , Please open a ticket with AWS support to raise this limit as needed
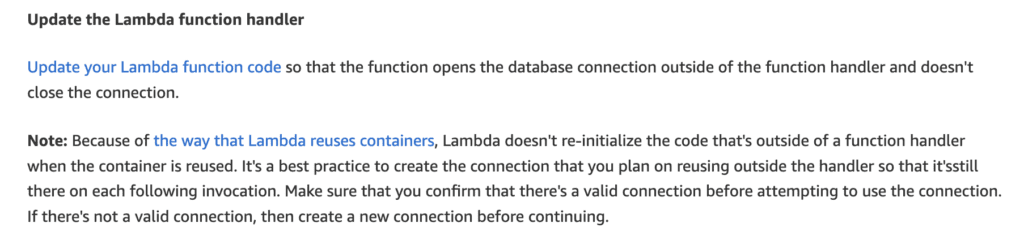
Try and reuse connection
Below is an excerpt from AWS docs and it explains how opening of a database connection outside of the function handler can help
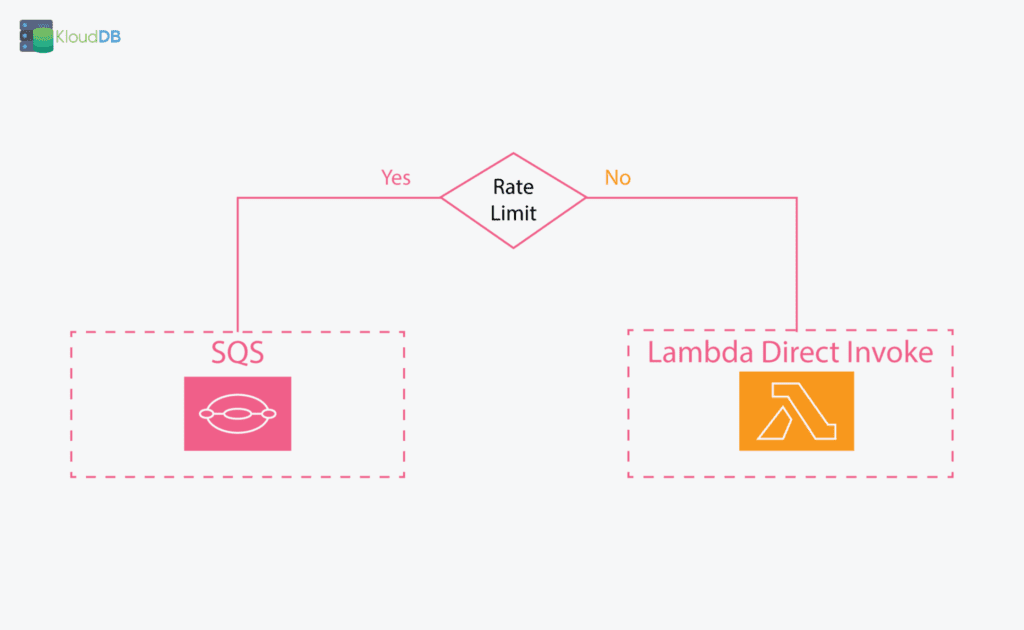
Usage of SQS queue can help
Depending on your use case using sqs queue can help , you can use sqs dlq to re execute failed invocations and also throttle the executions via queue
Conclusion
Following above steps we were able to reduce the latency average to 230 milliseconds (from 30,000 milliseconds). Lambda management is different when compared to cron jobs or other methods that we were using in non-cloud environments. Please also check our other performance articles – Pgbouncer multiple instances , Postgres and temporary files , Pgpool and performance tuning etc..
Looking for Postgres support ? Please reach us at support@klouddb.io